The work behind a big decision ends up scattered between dashboards and somebody's presentation. SignalFlare brings the data, technology, and people together to unlock better, more efficient decision-making across your business.
Trusted by



One workspace for your teams and AI agents to work together on growing your business.
Learn more
One system, every decision.
Promotion
Stop paying for traffic you were going to get anyway.
Operations
Pinpoint where you’re leaving money, down to the store, daypart, and channel.
Location
Know what a trade area can feed before you sign ten years of lease.
Crafting a high-stakes decision is a precise combination of art and science.

01 ·
Demand
Know your markets.
Every decision begins with deep insights into how local consumers are speaking with their feet, wallets, and voices.
See what comes with the platform

02 ·
Context
The second brain of your business.
Model your data, your tribal knowledge, and your decisions into a context management layer that’s yours and stays yours.







03 ·
Analysis
Work you can delegate.
Reliable, restaurant-trained AI agents do real analytical work: pulling, joining, cross-checking, and reasoning over data too complex to work through by hand.
Explore Navigator

04 ·
Recommendations
Risk-adjusted recommendations.
Go beyond incremental revenue and know the risk by simulating impact and generating recommendations grounded in real consumer behaviors.
Request access
01
The hard part is already done.
The restaurant ontology, the connectors, the proven analytical models — pre-built, from thirty years driving decisions for the industry's top chains. You don't need a perfect data stack to begin; you need a question.
The old way: Half a year of data plumbing before the first useful answer.
02
The AI can't afford to guess.
The brands that come to us are facing decisions worth millions. Navigator reasons over your modeled data, so it already knows what you mean by check average, by comp, by core item.
The old way: Point a chatbot at raw systems and hope it picks the right one of your fourteen sales tables.
03
It compounds.
The context that guided the decisions from three months ago is recorded. The memory builds to power your next decision, so that someone new to the team inherits what the company has already learned.
The old way: Analyses often start from scratch, plus the unmitigated risk of what was learned walking out the door.
Setup
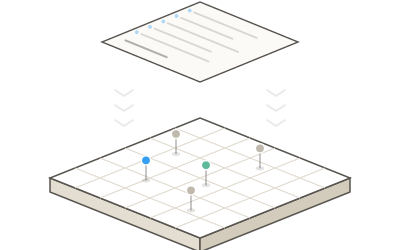
Start with your store list.
Add a list of your locations and it gets geocoded and enriched with supply and demand data from your trade areas.

Stores
See who your guests are.
Gain insights into your visitors' purchase power, demographics, and home/work origins, store by store.
Neighborhoods
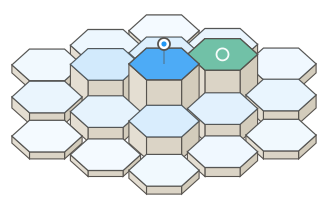
Explore your trade areas
Competitors, the mix of restaurant visitors, and demand patterns across your current and future markets.

