
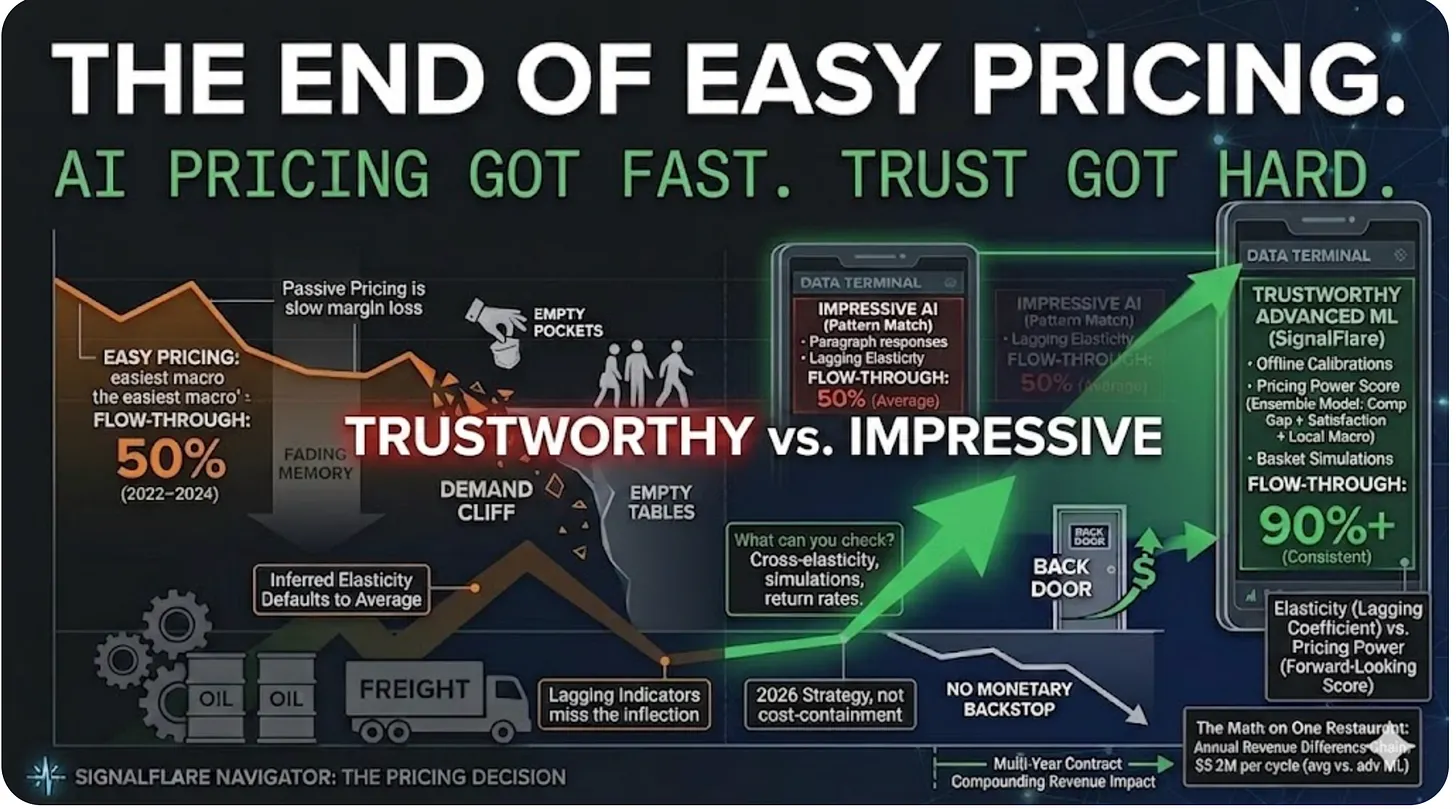
Restaurants are about to face the hardest pricing environment in decades. Not the hardest inflation — that was 2022. Something more difficult. A cost-side spike meeting a demand-side cliff. No monetary backstop. No consumer savings cushion.
Post-COVID inflation was, for restaurant pricing, the easiest macro in a generation. Over-stimulus, monetary policy gone awry, consumers flush with government transfers and pandemic savings that made Helicopter Ben’s TARP look like Ebenezer Scrooge. When headline CPI ran above 9% in mid-2022, the pricing advice was simple: aggressive across-the-board increases, taken early. Early movers stuck. Late movers — chains that priced reactively six or twelve months later — captured less and gave up share.
That consumer is not the consumer in the dining room today.
The low end dropped out two years ago. The middle has hollowed out. Frequency is down across casual and fast-casual. The top 10% of households carry an outsized share of restaurant spending. That concentration is fragility, not strength.
Now the cost side rises again. Oil moves first, freight follows, packaging follows that, and within two cycles every category coming in the back door is up. Meanwhile, the front door is showing fewer guests with less spending power, making more discerning decisions about where the dollar lands.
The math forces a choice. Hold prices and watch margin compress as COGS climb. Take prices and watch elasticity bite a more fragile traffic base harder than it did in 2022. A move that ignores either elasticity — basket or traffic — produces less revenue than before.
The third path is share capture. Share does not move on its own. How much share, taken from where, at what marketing spend — and how does the guest find out you are a better value than the chain across the parking lot, the grocery aisle, or anywhere else in the trade area? Share of stomach competes wider than the lot you can see. Passive pricing is not a strategy. It is a guarantee of slow margin loss. Pricing has to be part of the growth strategy in 2026, not a cost-containment lever.
The temptation is that AI has made pricing analysis available to everyone. Agents, copilots, vendors, consultants — the menu of options has multiplied in eighteen months. DIY pricing now looks as easy as vibe coding.
It probably is. And about as durable.
The Math, On One Restaurant
Pricing is the highest-leverage decision in a restaurant P&L. The McKinsey result is well-established: a 1% improvement in price realization yields roughly 8% in operating profit. The figure assumes the price move sticks without consequence. It rarely does.
Take a unit doing 10,000 transactions a week at a $10 average check — $100,000 weekly, $5.2M annually. A 1% menu price increase, applied naively, lifts the check by $0.10 and produces $1,000 in incremental weekly revenue. Annualized, $52,000. That is the theoretical ceiling. Realization runs below it.
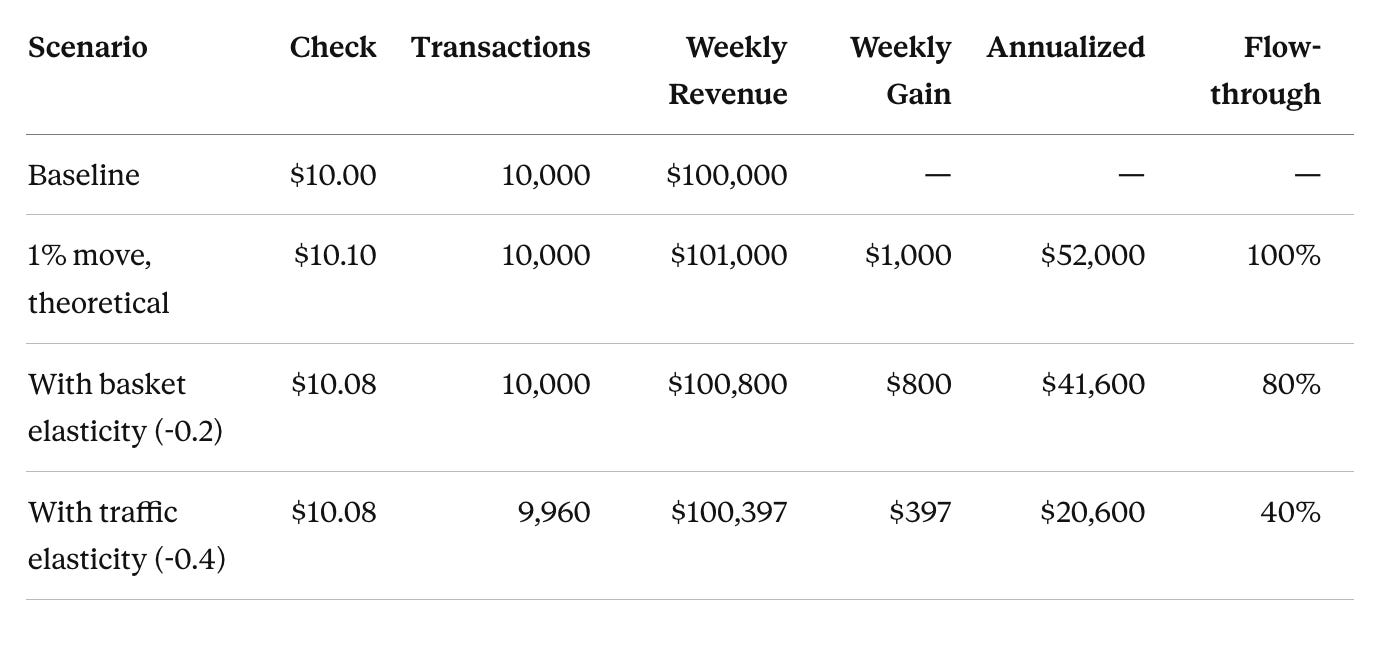
Two elasticities take a bite out of your realized flow-through. The first bite comes from check management, measured by Basket elasticity: the guest still walks in, but skips the appetizer, downsizes the entrée, drops the dessert, removes the drink. The second bite comes is Traffic elasticity - the response of transaction count: lost frequency cycle, lost occasion or lost customer altogether. The cascade:
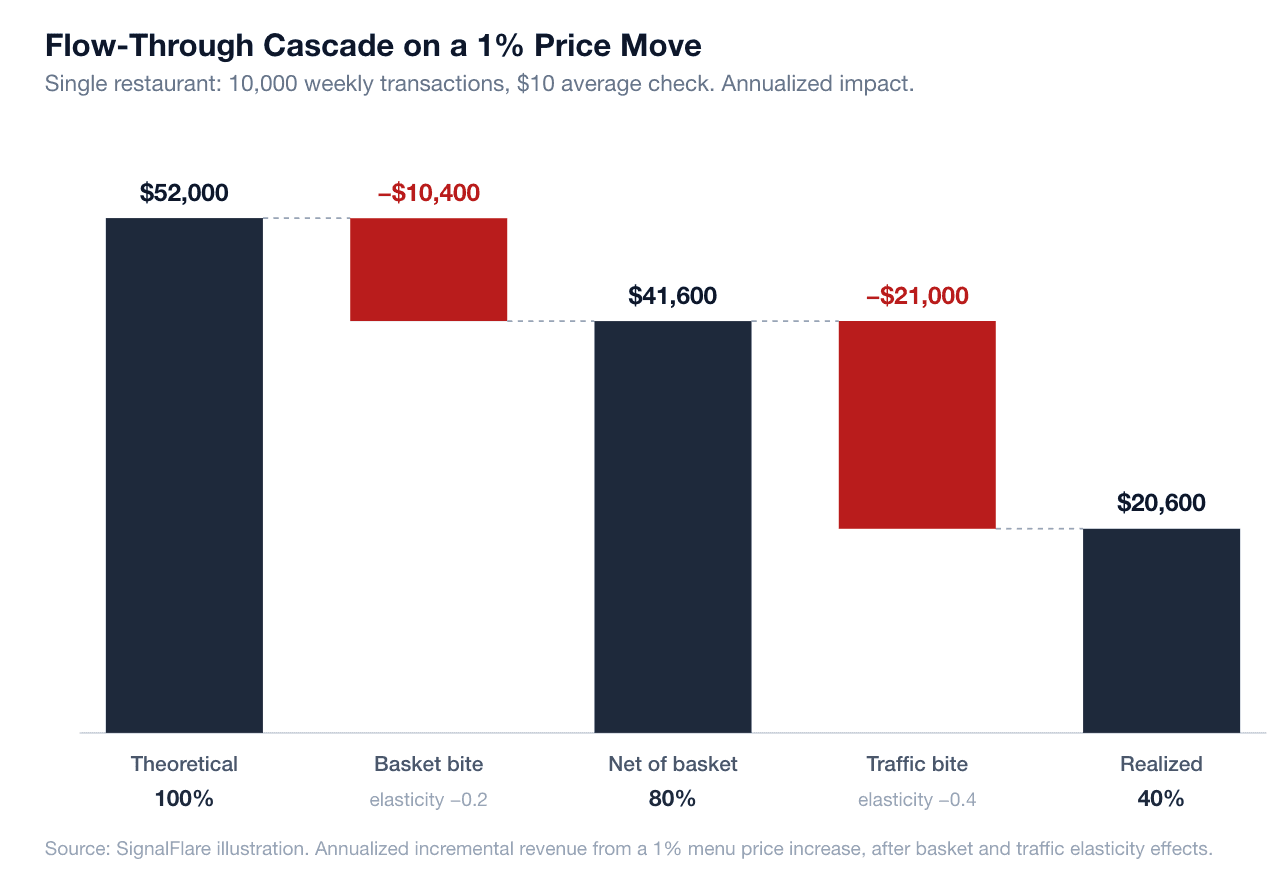
Annualized impact of a 1% menu price increase at a single restaurant, after basket and traffic elasticity effects.
The industry numbers are blunter than the example. SignalFlare transaction data shows restaurant CPI rose 17.6% cumulatively from 2022 to 2024 while actual check growth was 8.8%. Only about half of menu price increases stick. 50% flow-through is the average. Operators that price on calibrated elasticities can raise that to roughly 80%. Operators that pair elasticity with advanced ML and the right inputs can reach 90% or better, consistently.
The gap is not theoretical. On the example unit, the difference between 50% and 80% flow-through is $15,600 a year. Between 50% and 90% it is $20,800. Across a 250-unit chain at the same volume, the move from industry-average pricing to advanced-ML pricing closes a $5.2M revenue gap on every 1% pricing cycle. Most chains run two cycles a year.
Elasticity Is Not Pricing Power
The industry routinely collapses elasticity and pricing power into one term. They are not the same.
Price elasticity is a linear equation. The slope of a line, calculated from past data. It tells the operator what happened when prices moved. It does not tell the operator what will happen next time.
Pricing power is a different problem. A forward-looking score that asks what factors are about to shape the next price move — and whether those factors pull for the operator or against. Elasticity is descriptive. Pricing power is strategic.
The factors that determine pricing power do not appear in any elasticity coefficient:
Competitive position. Price gap to key competitors. Price gap to segment. Competitor saturation in the trade area.
Guest satisfaction. Direction and magnitude of recent satisfaction changes. A pricing move against deteriorating satisfaction is not the same move as one against improving satisfaction. Same elasticity, different power.
Customer composition. Demographics in the store and across the trade area — income, age, ethnicity. The base sitting in the dining room is rarely the base living within a five-mile radius. Both matter.
Visit context. Share of guests from work versus home. Distance travelled. A trade area built on commuter traffic responds to a price move differently than one built on neighborhood frequency.
Local macro. Local CPI. Purchasing power of the customer base. National numbers describe an economy that does not exist for most operators. Local numbers describe the one their guests live in.
SignalFlare combines these inputs through a best-of-three ensemble. Three model approaches run against the data; the strongest is selected for each location and item. This is materially different work than fitting a single elasticity coefficient to historical transactions. It produces a score, not a slope.
The distinction matters because elasticity-only tools answer the wrong question. A pricing recommendation derived from a clean elasticity model — even one calibrated correctly to the chain’s POS history — has answered “what slope did we sit on?” not “what slope can we shape, and in which direction, given everything else moving in the trade area?”
That is the gap between a 1995 method and a 2026 one. The first measures. The second decides.
The Worst Case Most Tools Cannot See
The worst case is not low flow-through. It is negative flow-through — the move that erodes the base.
This happens when prices are pushed past the inflection point on individual items. Once item-level price elasticity reaches -1.5 to -2.0, the dollar value of lost transactions exceeds the dollar value of the price gain. The unit moves backwards. By the time it shows up in the same-store-sales line, the next quarter’s plan has already been built on a number that isn’t there.
Most price elasticity algorithms are lagging indicators. They tell you what happened after it happened. The leading indicators sit in basket composition: guests downsize, drop attachments, and reorganize the ticket before they cut visits. A pricing system that only watches transaction counts will miss the inflection by a quarter. Cost-plus and follow-the-leader approaches produce this failure mode most often. It is the most expensive pricing mistake there is. It is also invisible on the screen output of any AI tool that cannot model basket and traffic at the item level.
What Agentic AI Changed
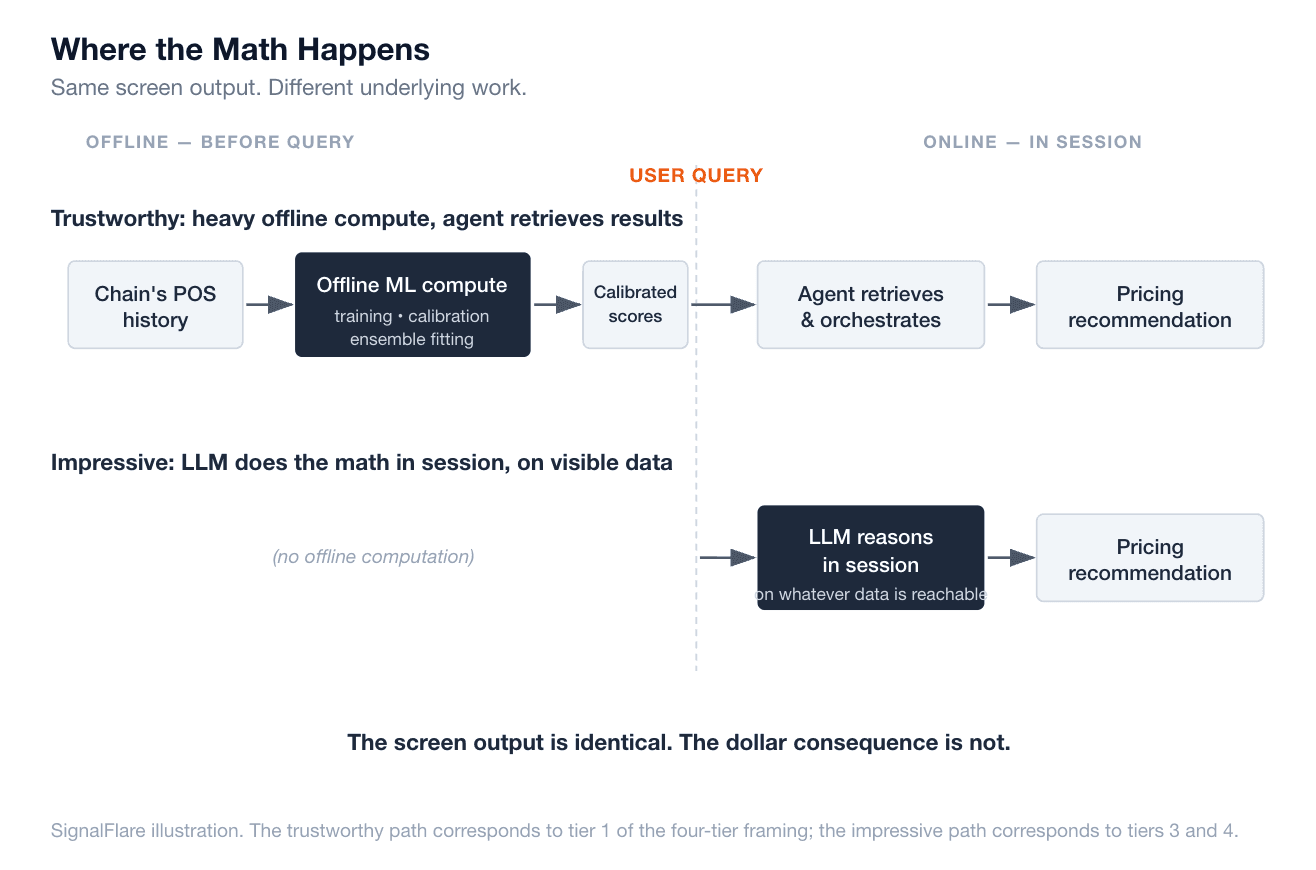
Caption: Same screen output. Different underlying work.
With the right wiring, an agent can pull competitor prices, query POS history, retrieve calibrated elasticities, run scenarios against a basket simulator, and explain the recommendation in one session. Analysts who spent days on pricing inputs can now run scenarios in an afternoon. That is real.
The math is not happening in the agent. Robust pricing systems run training, ensemble fitting, and calibration as heavy offline computation against the chain’s full data history. The agent retrieves results and orchestrates them. The models do the work.
The hard part: telling from the output whether that is the wiring — or whether the LLM is doing the math itself, in the moment, on whatever it can see.
The New Pricing Problem Is a Trust Problem
A confident answer from an agent is no longer evidence that analysis happened. The same screen output can come from four very different processes:
An agent that retrieves calibrated price elasticities computed offline against the chain’s POS history. Lands in the 80% band. The math has been in production use for 25 years. The lift comes from doing it at all instead of running cost-plus or competitor-matching.
An agent that retrieves results from an ensemble model combining POS calibrations with externalities — competitive position, demographics, satisfaction trends, visit context, local macro. Lands in the 90%+ band. Few agents are wired this way. This is the work that closes the gap.
An agent that read the menu and inferred plausible elasticity values from training data. Defaults to roughly the industry average. Looks reasonable. Isn’t.
An agent that pattern-matched to industry write-ups it had seen before. Produces sometimes-sensible, sometimes-expensive recommendations.
The text on the screen does not distinguish among them.
Decision-support tools have always had limits, but those limits used to be visible. A static report had stated sources. A regression had stated assumptions. A consultant’s deck had a methodology section. An agent’s output, by default, has none of that. The operator either trusts the wiring or doesn’t. Most have no instrument to check.
Where DIY Analysis Breaks
DIY rarely means what operators think it means.
Restaurant companies are excellent at running restaurants. The competencies that built the brand — site selection, operations, supply chain, menu development, hospitality — sit in a different domain than econometrics, machine learning, and behavioral modeling. When a chain restaurant with meaningful size and scale decides to fully DIY price analytics, the actual decision is to start a data science department, often without naming it that.
Three questions follow. They are rarely asked.
What is the team’s expertise? Most internal analytics groups at restaurant companies were hired to run reports, not to model elasticity. SQL and dashboards transfer; econometrics and machine learning rarely do. There is nothing wrong with that — but the knowledge and methodological gaps are usually not deeply understood until after the unexpected happens.
Are they adopting legacy methods without knowing it? AI agents and produce modern-looking output from very old underlying methods. A 2026 pricing recommendation can rest on a 1995 log-log regression, with no cross-effects and no calibration to the chain’s actual customers. The output reads new. The math is decades old. Without the expertise to discern the method, the team has no way to tell which one they got.
Who owns it when it goes wrong? When a vendor builds the system, the relationship is the place to raise underperformance. When the analysis comes from a general-purpose agent and a team without pricing science depth, underperformance is structurally invisible. The team does not know what to compare against. The agent does not know it was wrong. The only signal arrives in the same-store-sales line, two quarters late.
How to Tell Trustworthy from Impressive
A trustworthy pricing system can answer specific questions and show its work. What is the cross-elasticity assumption between this item and its alternative, and where did it come from? What does the recommendation do to the basket, not just the item? What is the simulated effect on next-quarter return rate, not just next-week ticket average? What did the system recommend last cycle, and was it right?
When the answers come from calculation and recorded history rather than prose, the system is doing different work. A trustworthy agent shows its work in a form an analyst could check. An impressive one tells a good story.
Before You Trust the Output
Operators who can tell trustworthy work from impressive work will capture the upside. Operators who cannot will pay for that gap two quarters later, in the same-store-sales line.
Pricing is the place where the gap is most expensive to ignore. On the 250-unit chain example, the spread between industry-average and advanced-ML pricing runs to $5.2M per cycle. Doubled across two cycles a year. Compounded across a multi-year contract. That is eight figures inside two years before counting the worst-case mistakes that cost-plus and follow-the-leader approaches occasionally produce.
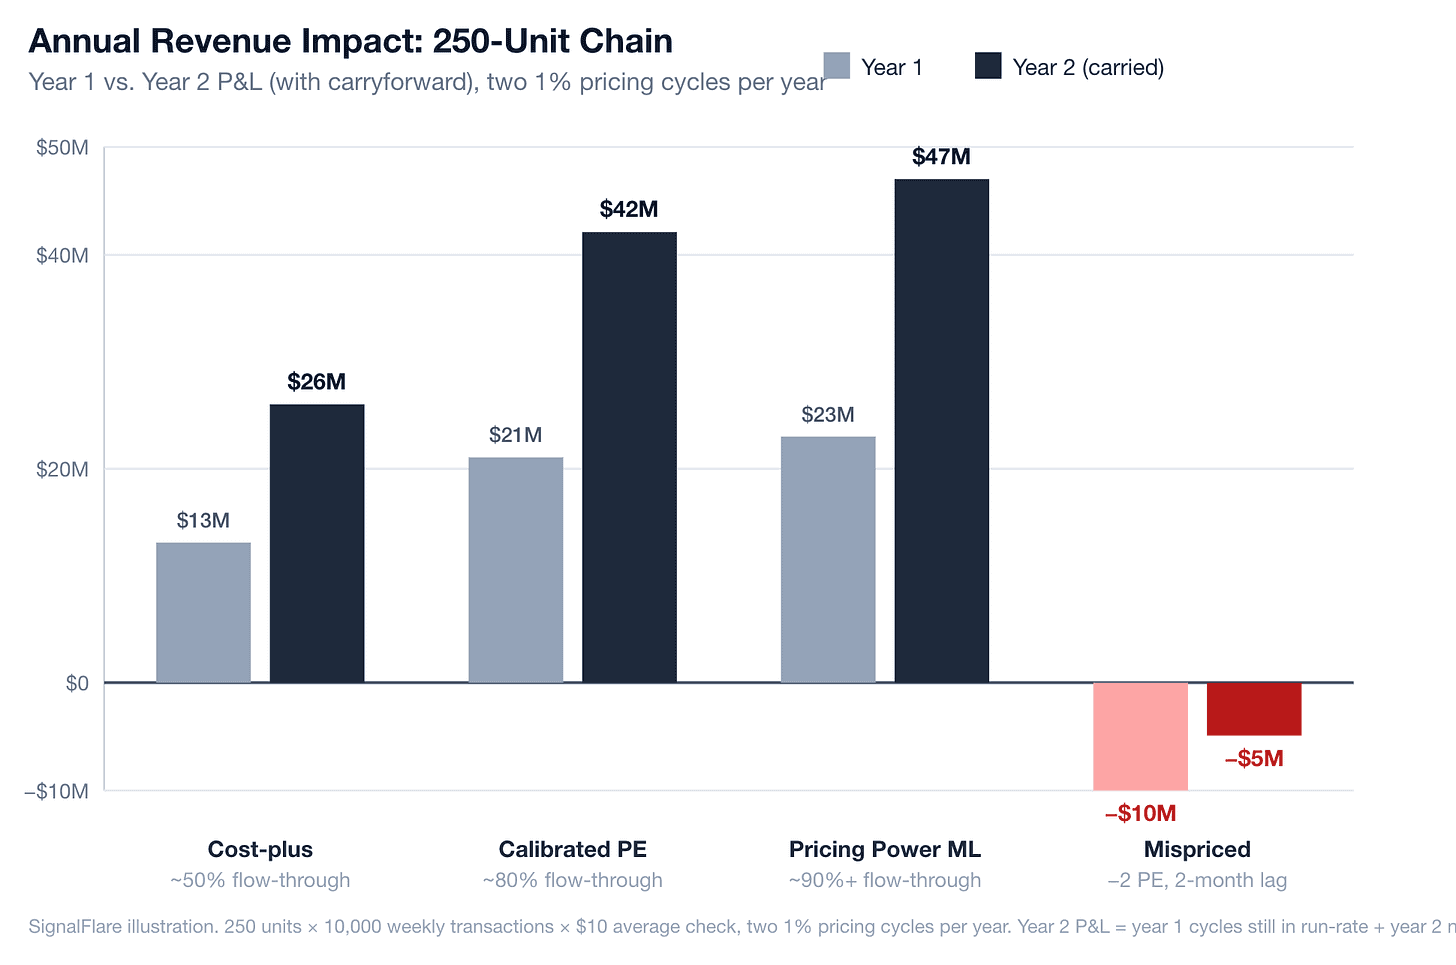
Caption: Annual P&L impact across pricing tiers, 250-unit chain. Year 2 reflects year 1 cycles still in run-rate plus year 2 new cycles. Mis-pricing compounds in the other direction.
The questions to ask any AI pricing recommendation are not about the model. They are about what the model can see, what it can calculate, what it remembers, and whether the operator can check any of it:
What does it see? Unit-level POS history, or inferences from training data?
What does it calculate? Just elasticity — or pricing power, which adds competitive position, satisfaction trends, trade-area demographics, visit context, and local macro to the slope?
What does it remember? Last cycle’s recommendation, what was implemented, what the market did — or does it start over every session?
What can the operator check? Cross-elasticity assumptions, basket simulations, return-rate effects, prior-cycle accuracy — or just the final number?
Does it know guests come back? Repeat-frequency response, not just transaction-count response.
The real advantage of the new generation of AI agents isn’t that it’s easy to run old statistical code instantly on any data set - that’s actually a liability. It’s that all the hard things that have required human analysts and manual processes are becoming easier, and when they are built correctly they are constantly learning. And that is the biggest payoff.
SignalFlare Navigator runs calibrated pricing power for multi-unit restaurant operators — offline ML, ensemble models, agents that retrieve rather than improvise. If you want to see how the wiring works, drop a note.
Data sources: SignalFlare Navigator transaction records; BLS Consumer Price Index for Restaurants. Methodology references: Marn, Roegner, and Zawada, “The Power of Pricing,” McKinsey Quarterly. Anderson and Simester, “Effects of $9 Price Endings on Retail Sales,” Quantitative Marketing and Economics. Kalyanam and Shankar, “Price Elasticity in Retail Categories,” Journal of Marketing Research.
Share

